How to Properly Make Venn Diagrams Using Python Packages
Venn diagrams play an important role in graphical visualization.
In Venn diagrams of two sets, you can have two (or more) overlapping circles representing sets of different sizes, but the circles are the same size. Actually, the circles should be proportional to the size of the sets, and the overlapping area should be proportional to the data overlap. This way, you can immediately see the overlapping numbers before noticing the exact figures.
This article will explain in detail how to use the Venn functions (matplotlib_venn) in Python to create simple and visually appealing Venn diagrams, including those for two lists and three lists.
Important functions include venn2, venn2_circles; one method is to directly pass lists, and venn2_circles requires manual calculation which is more complicated. Therefore, this article introduces the plotting with venn2.
Steps:
- Import necessary packages
- Prepare data for plotting
- Call the functions to plot
Import Necessary Packages
If the package is not installed locally, install it using pip:
pip install matplotlib_venn
Here is the code:
import pandas as pd
import numpy as np
import matplotlib as mpl
from matplotlib_venn import venn3, venn3_circles
from matplotlib_venn import venn2, venn2_circles
Prepare Data for Plotting
Here we generate lists of random data under 100 for the Venn diagram.
list1 = np.random.randint(100, size=50)
list1
# array([ 6, 37, 81, 70, 38, 94,  2, 36, 74, 56, 25, 82, 96, 58, 16, 86, 40,
#       95, 38,  4, 23, 58, 39,  0, 38, 78, 73, 26, 81,  5,  1, 12, 99, 86,
#        0, 71,  0, 58, 26, 19, 82, 71,  5, 29,  1, 61, 28,  6, 85, 87])

list2 = np.random.randint(100, size=50)
list2
# array([91,  3,  6, 98, 91, 54,  8, 72, 10, 57, 84,  4, 87, 65,  7, 72, 43,
#       48, 88, 42, 21, 87, 18, 19, 78, 99, 32, 23, 87, 47, 56, 47, 34, 96,
#       99, 17, 96, 96, 18, 68,  2, 15, 41, 71, 97, 51, 69, 36, 74, 28])

list3 = np.random.randint(100, size=50)
list3
# array([81, 55, 72,  6, 16, 20,  3, 48, 76, 76, 58, 65, 82, 23, 24, 72, 54,
#       80, 21, 54, 19, 95, 54,  3, 98, 25, 41, 14, 73, 71, 38, 49, 22, 97,
#       47, 31, 46, 98,  5, 14, 76, 16, 92, 20, 82,  9, 56, 37, 98,  6])
Call Functions to Plot
Start plotting Venn diagrams: one between two lists (list1 and list2), and another among three lists (list1, list2, and list3).
The function input is an array of sets containing the lists for the Venn diagram; labels can be specified.
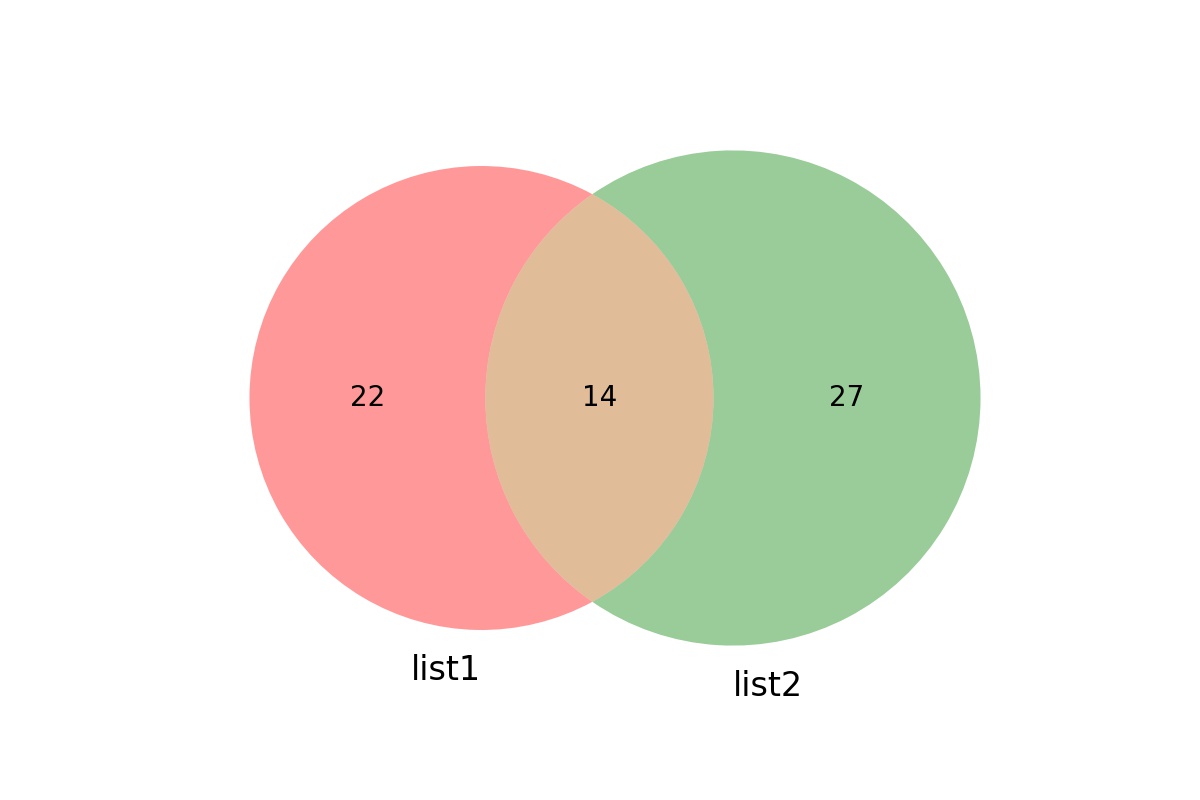
## Venn diagram for two lists
venn2([set(list1), set(list2)], set_labels=('list1', 'list2'))
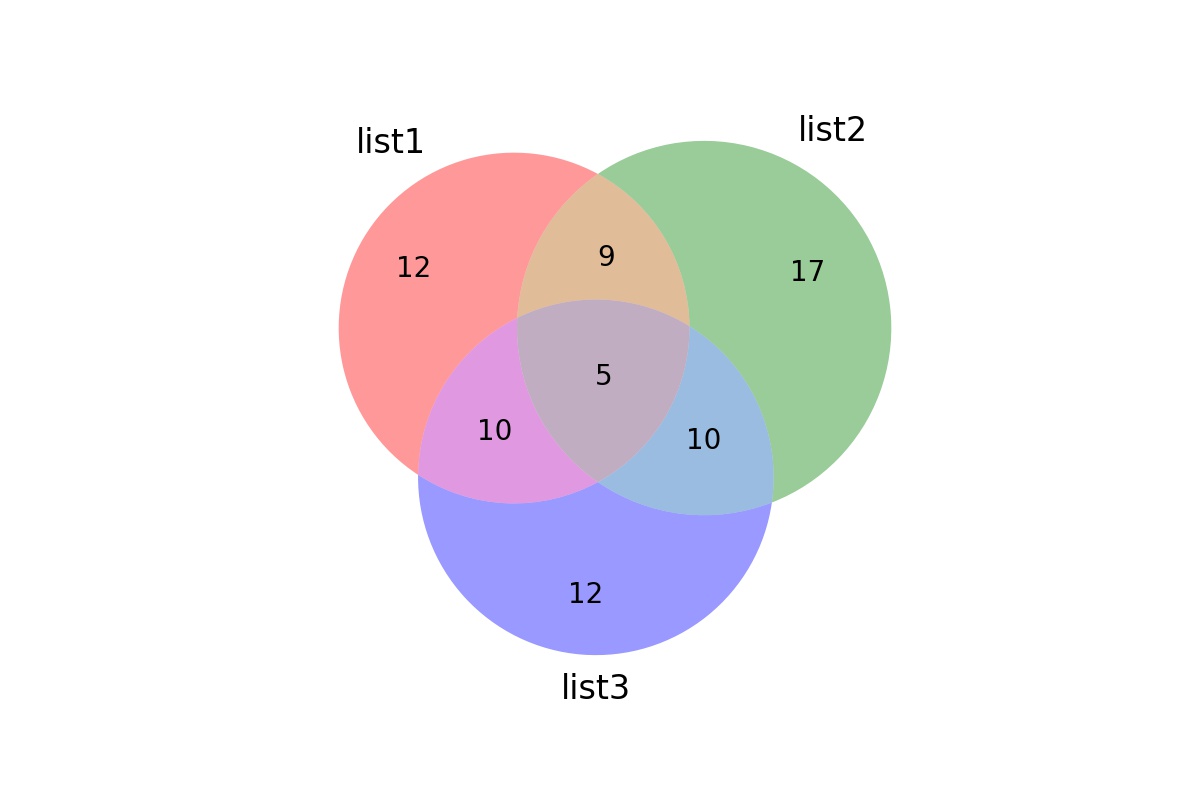
## Venn diagram for three lists
venn3([set(list1), set(list2), set(list3)], set_labels=('list1', 'list2', 'list3'))
First Venn diagram:
Second Venn diagram:
Summary
This article mainly introduces a convenient package for drawing Venn diagrams, matplotlib_venn. The venn2 and venn3 plotting functions are really handy. For more function usages, please check the official documentation:
matplotlib-venn
- 原文作者:春江暮客
- 原文链接:https://www.bobobk.com/en/523.html
- 版权声明:本作品采用知识共享署名-非商业性使用-禁止演绎 4.0 国际许可协议进行许可,非商业转载请注明出处(作者,原文链接),商业转载请联系作者获得授权。