

When visualizing data, it's common to plot multiple charts in a single figure. For example, visualizing the same variable from different perspectives like side-by-side histograms and boxplots for numerical variables is useful.
When visualizing data, it's common to plot multiple charts in a single figure. For example, visualizing the same variable from different perspectives like side-by-side histograms and boxplots for numerical variables is useful.
When using scrapy to crawl web pages, many websites render content with JavaScript, so directly fetching the source code will not get the needed content. In this case, using selenium to drive a browser to get the rendered content is very suitable.
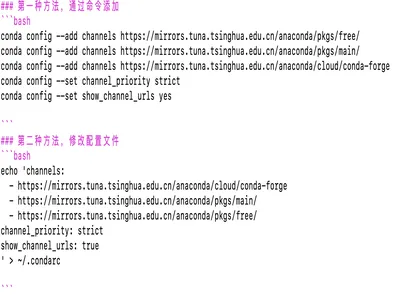
Since the default addresses for pip and anaconda are very slow to access in China, adding domestic mirrors for acceleration is necessary.
This article will guide you through a hands-on implementation of a powerful random forest machine learning model. It aims to complement my conceptual explanation of random forests, but as long as you have a basic understanding of decision trees and random forests, you can fully read it. Later, we will discuss how to improve the model built here.
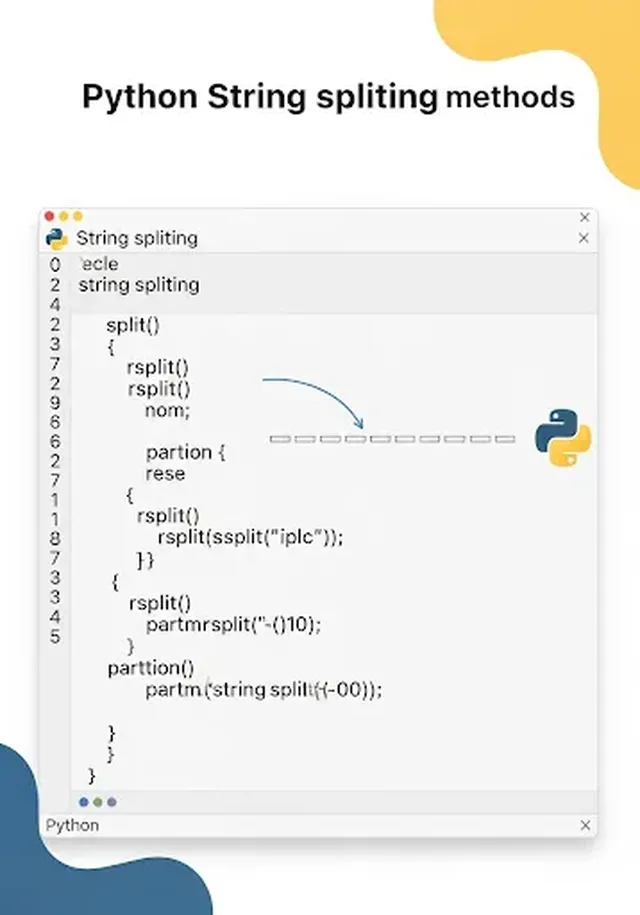
Today I will introduce to you various string segmentation methods that can be used in Python. They are

'Many domain enthusiasts scour forums and websites frantically searching for and snatching up suitable domains, even spending heavily to buy desired domains from their owners. International domain management bodies adopt a "first-to-apply, first-to-register, first-to-use" policy. Since domains only require a small annual registration fee, continuous registration grants you the right to use the domain. Because of this, many domain resellers (commonly known as "domaining pros") often spend heavily on short, easy-to-remember domains. I used to think about buying shorter domains for building scraping sites, but unfortunately, both snatching and buying from others were very expensive. Since it"s first-come, first-served, we can also acquire good domains by registering them before the current owner forgets to renew.'
Logic is used in most intelligent activities, but it is mainly regarded as a discipline in psychology, learning, philosophy, semantics, mathematics, inferential statistics, brain science, law, and computer science.

This is an article analyzing a problem from the coding practice site LeeCode.
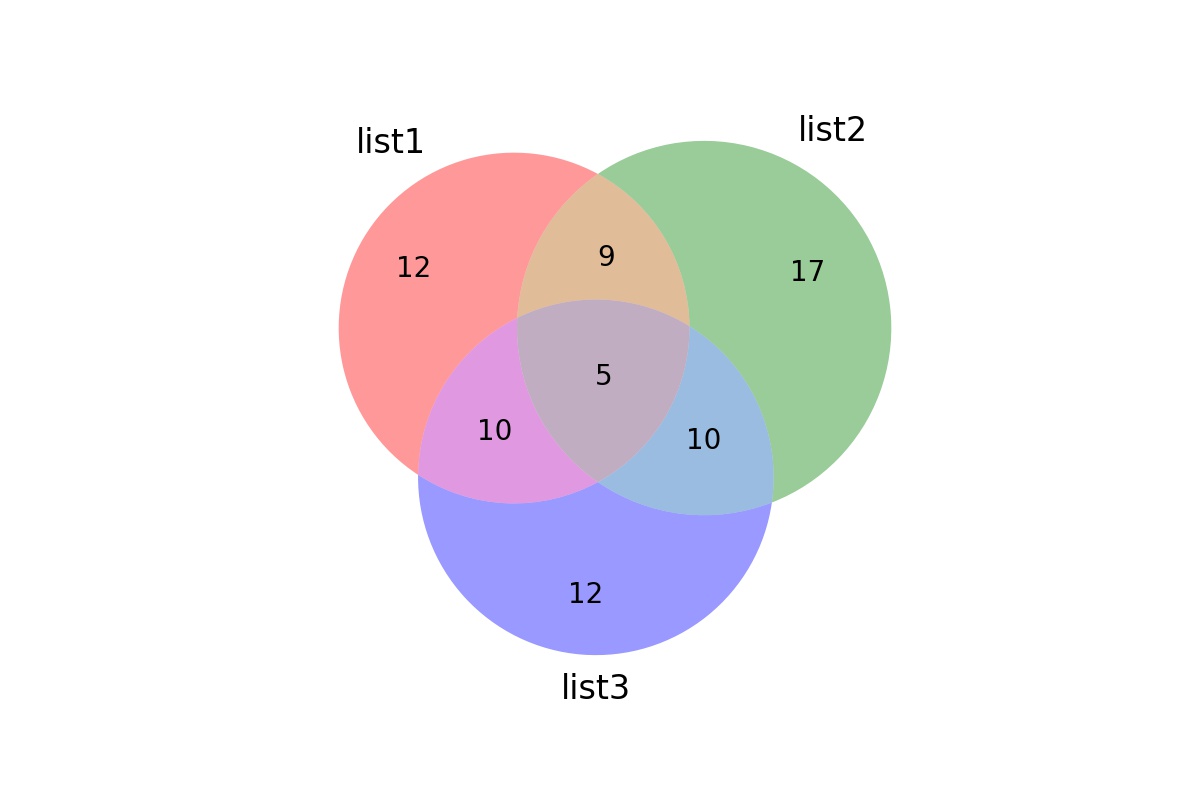
In Venn diagrams of two sets, there can be two (or more) overlapping circles representing sets of different sizes, but the circles are the same size. Actually, the circles should be proportional to the size of the sets, and the overlapping area should also be proportional to the data overlap.
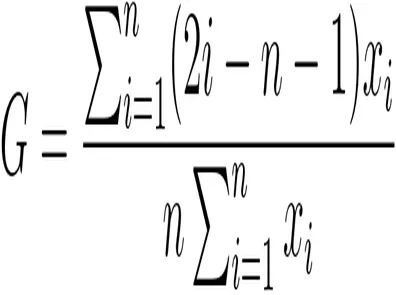
The Gini coefficient and Lorenz curve are widely used to represent data inequality, especially wealth inequality. However, currently in Python, there isn't a very good function to directly plot the Lorenz curve. Since the current project requires it, this article records how to use numpy, pandas, matplotlib, and other packages to calculate the Gini coefficient and plot the Lorenz curve for practical use.
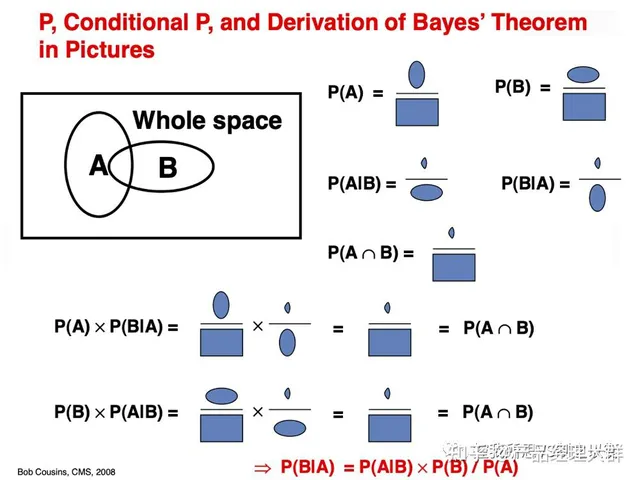
Bayesian theory provides a principled method for calculating conditional probabilities. With it, we can easily compute conditional probabilities for events where intuition often fails.
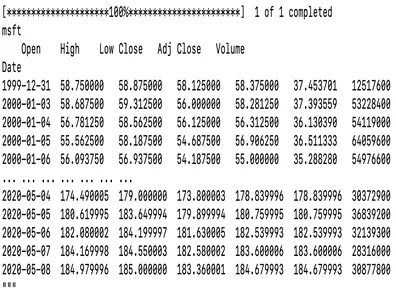
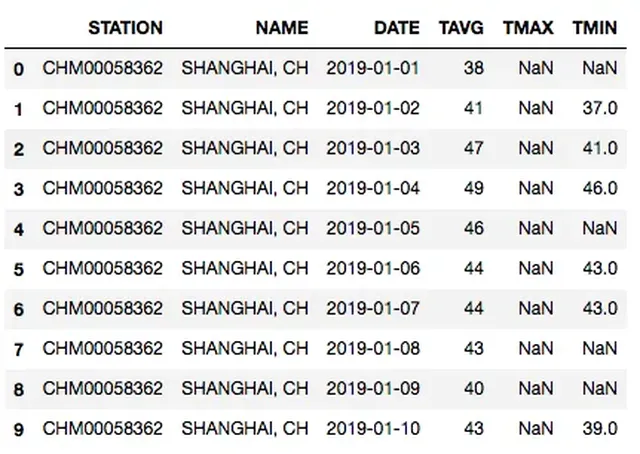
Historical stock data is a very important kind of time series data, playing a significant role in data science. Let's start learning how to handle time series data, preparing for future stock prediction and analysis.