BOBOBK

Designing Baidu SEO Click Software with GUI using PyQt6

TECHNOLOGY
Designing Baidu SEO Click Software with GUI using PyQt6

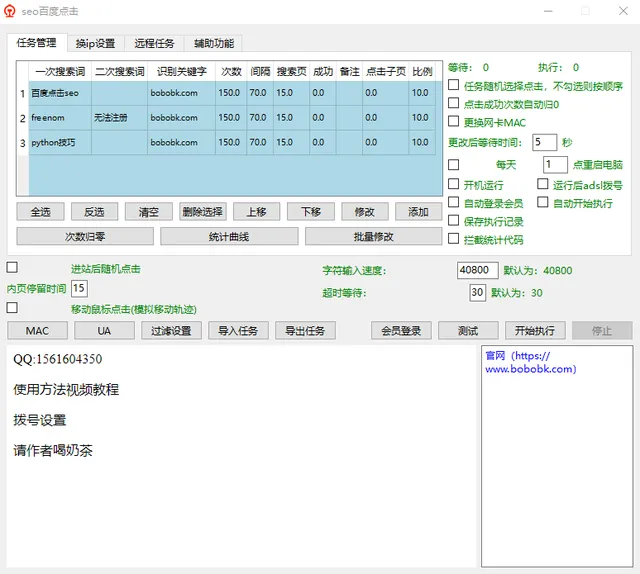
For webmasters, improving search engine rankings through website SEO and attracting more organic users is crucial for continuously increasing website traffic. In addition to improving the quality of their own website content, simulating searches and clicks on search engines is a complementary method. After comparing various existing Baidu and Sogou click software, designing a customizable SEO click software of one's own seems very challenging and meaningful. Recently, I've also been learning PyQt6 as a GUI programming package, which is perfect for this task.

How to Install Old Version R Packages in R

TECHNOLOGY
How to Install Old Version R Packages in R

To leverage the efficiency improvements and bug fixes of R version updates, I upgraded R on my server to the latest version (currently 4.1). However, when using some packages, I encountered errors.

The Lion and the Wolf

MISCELLANEOUS
The Lion and the Wolf

Benefits of Trade

MISCELLANEOUS
Benefits of Trade

Recently, I have been reading Gregory Mankiw's "Principles of Economics" and found it quite interesting. Here, I share one example that trade can benefit both parties, creating a win-win situation rather than one winner and one loser.

Drawing Raincloud Plots with Python

TECHNOLOGY
Drawing Raincloud Plots with Python

When performing exploratory analysis, bar charts and box plots are excellent methods that can effectively display the general data structure and distribution. Recently, I saw someone using raincloud plots to display data, and the graphics looked beautiful and interesting. Therefore, I have organized this information and implemented the drawing of raincloud plots using Python.

Introduction to Canonical Correlation Analysis and Python Implementation

TECHNOLOGY
Introduction to Canonical Correlation Analysis and Python Implementation

When handling high-dimensional data, we can use LDA, PCA, etc., for dimensionality reduction. But what if two datasets come from the same samples but differ in data types and scales? This is where Canonical Correlation Analysis (CCA) becomes useful.

Calculating Confidence Intervals Using Bootstrapping

TECHNOLOGY
Calculating Confidence Intervals Using Bootstrapping

Confidence interval (CI) is the range within which the population parameter lies with a certain confidence level. It is estimated based on the original observed sample and is usually defined as 95%, commonly referred to as the 95% confidence interval.

Choice of Preprocessing Methods: Scale, Standardize, Normalize

TECHNOLOGY
Choice of Preprocessing Methods: Scale, Standardize, Normalize

Many machine learning methods require data to be approximately normally distributed and as close as possible to normality. In Python, sklearn is the popular package for machine learning, providing functions including MinMaxScaler, RobustScaler, StandardScaler, and Normalizer for preprocessing.

The c-index and Its Application in Survival Analysis

TECHNOLOGY
The c-index and Its Application in Survival Analysis

The concordance index (c-index) is a metric used to evaluate the performance of predictive models, particularly in survival analysis. It is defined as the proportion of concordant pairs at all time points.

Python Native Lists vs. NumPy Arrays

TECHNOLOGY
Python Native Lists vs. NumPy Arrays

In Python, you can choose from various native data types to store collection data, including list, array, tuple, and dictionary. Among these, the list is highly flexible, can store any content, and is mutable, making it widely applicable. However, for scientific computing and storing purely numerical data, NumPy is widely used and has practically replaced lists. So, what are the differences between them, how significant are these differences, and how should they be applied in practice?

K-Means Clustering and Implementation with sklearn

TECHNOLOGY
K-Means Clustering and Implementation with sklearn

Cluster analysis allows us to find groups of similar samples or features, with stronger correlations among these objects. Common uses include grouping samples by different gene expression profiles or grouping genes by classifications of different samples.