BOBOBK

Using Matplotlib's fill_between for Area Filling in Python

TECHNOLOGY
Using Matplotlib's fill_between for Area Filling in Python

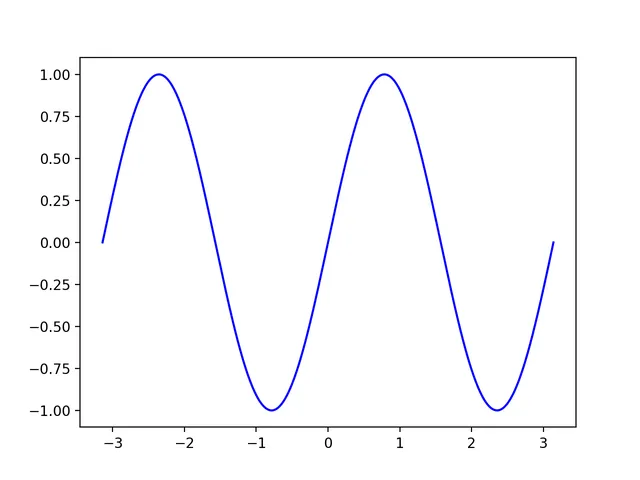
When plotting with matplotlib in Python, sometimes to enhance the aesthetics of the graph, it's necessary to fill with color above or below the plot. The 'fill_between' function is used for this, where the 'y2' parameter determines the second line, indicating whether to fill upwards or downwards.
Calculating Confidence Intervals Using Bootstrapping

TECHNOLOGY
Calculating Confidence Intervals Using Bootstrapping

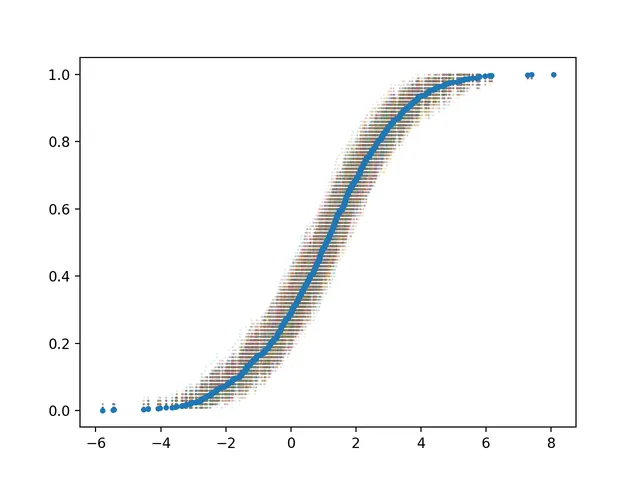
Confidence interval (CI) is the range within which the population parameter lies with a certain confidence level. It is estimated based on the original observed sample and is usually defined as 95%, commonly referred to as the 95% confidence interval.

K-Means Clustering and Implementation with sklearn

TECHNOLOGY
K-Means Clustering and Implementation with sklearn

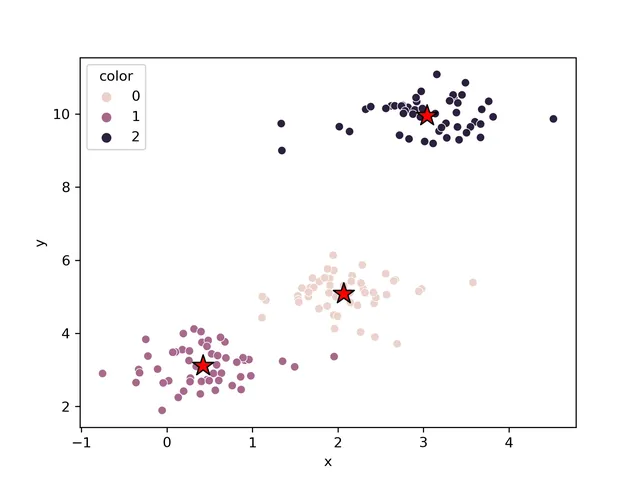
Cluster analysis allows us to find groups of similar samples or features, with stronger correlations among these objects. Common uses include grouping samples by different gene expression profiles or grouping genes by classifications of different samples.

Four Plotting Tips in Python

TECHNOLOGY
Four Plotting Tips in Python

When visualizing data, it's common to plot multiple charts in a single figure. For example, visualizing the same variable from different perspectives like side-by-side histograms and boxplots for numerical variables is useful.

Google Advertisement

Calculating the Gini Coefficient and Plotting the Lorenz Curve with matplotlib

TECHNOLOGY
Calculating the Gini Coefficient and Plotting the Lorenz Curve with matplotlib

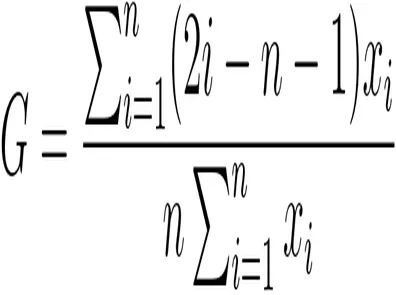
The Gini coefficient and Lorenz curve are widely used to represent data inequality, especially wealth inequality. However, currently in Python, there isn't a very good function to directly plot the Lorenz curve. Since the current project requires it, this article records how to use numpy, pandas, matplotlib, and other packages to calculate the Gini coefficient and plot the Lorenz curve for practical use.

Drawing the Butterfly Curve with Python

TECHNOLOGY
Drawing the Butterfly Curve with Python