

To leverage the efficiency improvements and bug fixes of R version updates, I upgraded R on my server to the latest version (currently 4.1). However, when using some packages, I encountered errors.
To leverage the efficiency improvements and bug fixes of R version updates, I upgraded R on my server to the latest version (currently 4.1). However, when using some packages, I encountered errors.
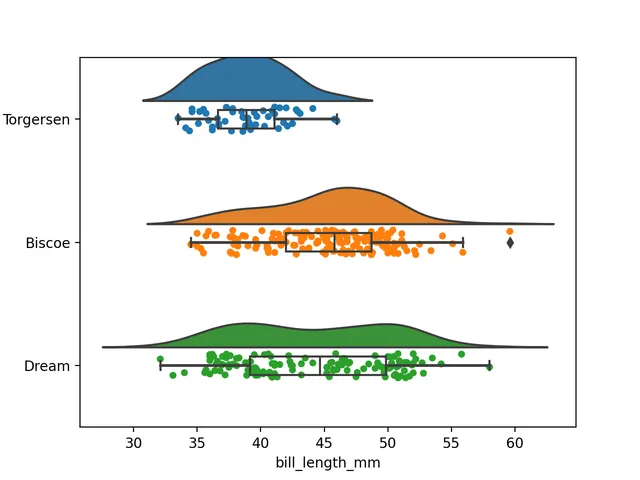
When performing exploratory analysis, bar charts and box plots are excellent methods that can effectively display the general data structure and distribution. Recently, I saw someone using raincloud plots to display data, and the graphics looked beautiful and interesting. Therefore, I have organized this information and implemented the drawing of raincloud plots using Python.
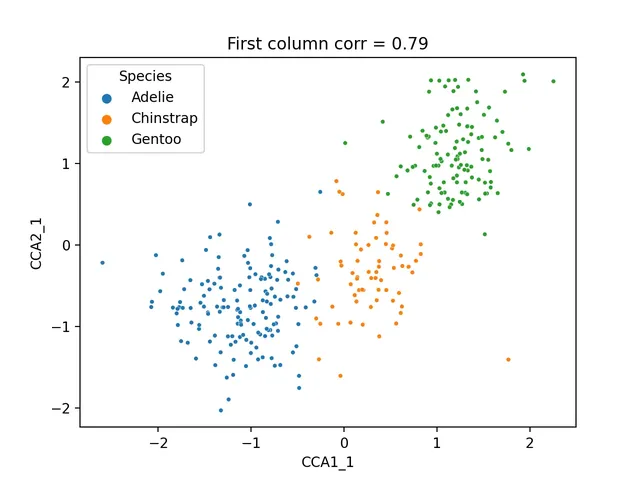
When handling high-dimensional data, we can use LDA, PCA, etc., for dimensionality reduction. But what if two datasets come from the same samples but differ in data types and scales? This is where Canonical Correlation Analysis (CCA) becomes useful.
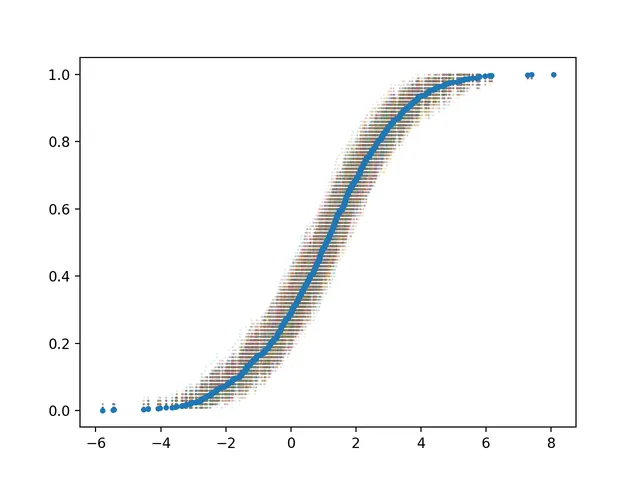
Confidence interval (CI) is the range within which the population parameter lies with a certain confidence level. It is estimated based on the original observed sample and is usually defined as 95%, commonly referred to as the 95% confidence interval.
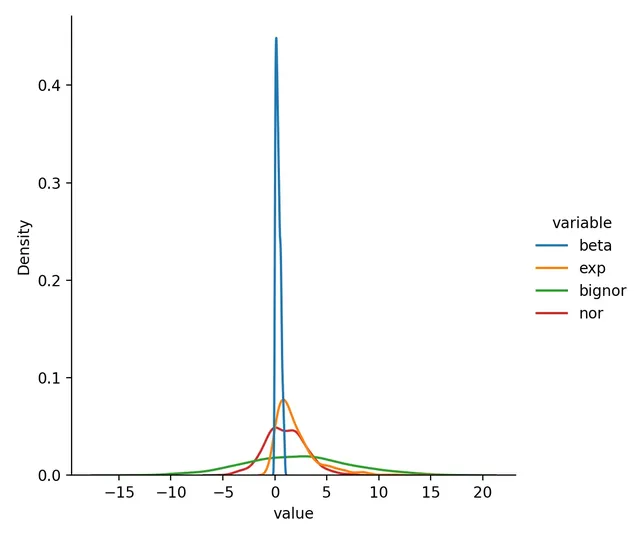
Many machine learning methods require data to be approximately normally distributed and as close as possible to normality. In Python, sklearn is the popular package for machine learning, providing functions including MinMaxScaler, RobustScaler, StandardScaler, and Normalizer for preprocessing.

The concordance index (c-index) is a metric used to evaluate the performance of predictive models, particularly in survival analysis. It is defined as the proportion of concordant pairs at all time points.
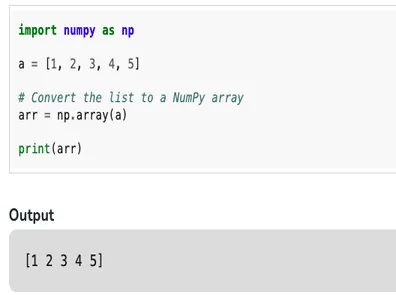
In Python, you can choose from various native data types to store collection data, including list, array, tuple, and dictionary. Among these, the list is highly flexible, can store any content, and is mutable, making it widely applicable. However, for scientific computing and storing purely numerical data, NumPy is widely used and has practically replaced lists. So, what are the differences between them, how significant are these differences, and how should they be applied in practice?
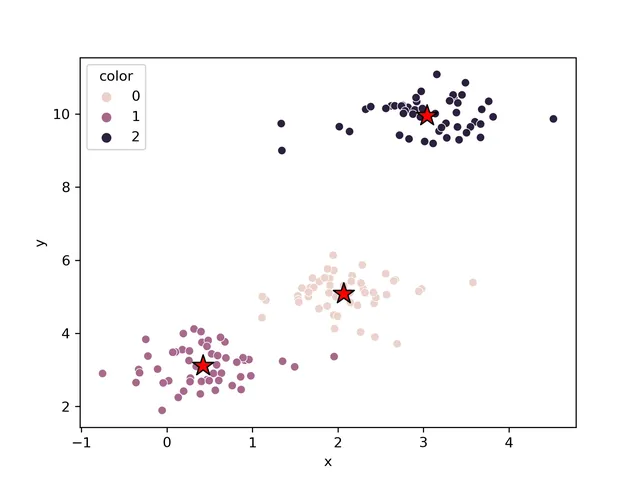
Cluster analysis allows us to find groups of similar samples or features, with stronger correlations among these objects. Common uses include grouping samples by different gene expression profiles or grouping genes by classifications of different samples.

When visualizing data, it's common to plot multiple charts in a single figure. For example, visualizing the same variable from different perspectives like side-by-side histograms and boxplots for numerical variables is useful.
When using scrapy to crawl web pages, many websites render content with JavaScript, so directly fetching the source code will not get the needed content. In this case, using selenium to drive a browser to get the rendered content is very suitable.
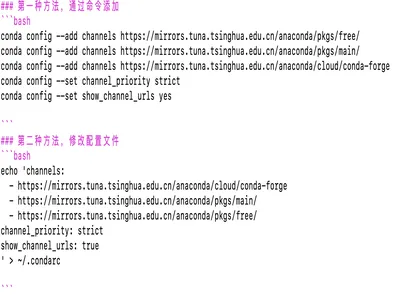
Since the default addresses for pip and anaconda are very slow to access in China, adding domestic mirrors for acceleration is necessary.
This article will guide you through a hands-on implementation of a powerful random forest machine learning model. It aims to complement my conceptual explanation of random forests, but as long as you have a basic understanding of decision trees and random forests, you can fully read it. Later, we will discuss how to improve the model built here.