BOBOBK

Using Matplotlib's fill_between for Area Filling in Python

TECHNOLOGY
Using Matplotlib's fill_between for Area Filling in Python

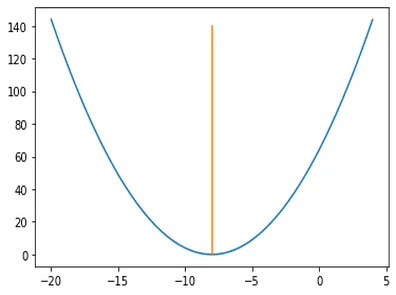
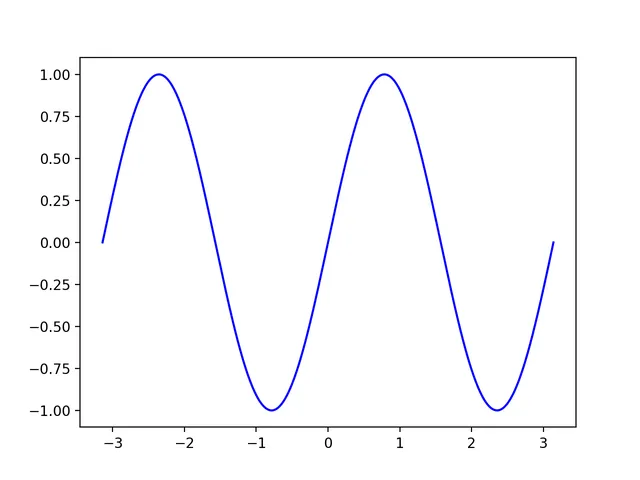
When plotting with matplotlib in Python, sometimes to enhance the aesthetics of the graph, it's necessary to fill with color above or below the plot. The 'fill_between' function is used for this, where the 'y2' parameter determines the second line, indicating whether to fill upwards or downwards.

Python: Creating Beautiful Lollipop Charts

TECHNOLOGY
Python: Creating Beautiful Lollipop Charts

The lollipop chart, as a variant of bar charts and dot plots, is increasingly popular in scientific research due to its simplicity and clarity. This chart cleverly combines the advantages of bar charts and scatter plots, offering a visually more attractive way to represent data.

Downloading m3u8 Streaming Media Using Python and Embedding into AMP Webpages

TECHNOLOGY
Downloading m3u8 Streaming Media Using Python and Embedding into AMP Webpages

In the era of short videos and live streaming, video formats are often no longer traditional ones like mp4 or mkv, but streaming formats such as m3u8. If you want to download your favorite videos, special handling is needed. This article provides a detailed example of how to download m3u8 streaming data using Python and embed it into an AMP webpage for playback. Let’s dive into the full process.

Drawing Raincloud Plots with Python

TECHNOLOGY
Drawing Raincloud Plots with Python

When performing exploratory analysis, bar charts and box plots are excellent methods that can effectively display the general data structure and distribution. Recently, I saw someone using raincloud plots to display data, and the graphics looked beautiful and interesting. Therefore, I have organized this information and implemented the drawing of raincloud plots using Python.

Introduction to Canonical Correlation Analysis and Python Implementation

TECHNOLOGY
Introduction to Canonical Correlation Analysis and Python Implementation

When handling high-dimensional data, we can use LDA, PCA, etc., for dimensionality reduction. But what if two datasets come from the same samples but differ in data types and scales? This is where Canonical Correlation Analysis (CCA) becomes useful.

The c-index and Its Application in Survival Analysis

TECHNOLOGY
The c-index and Its Application in Survival Analysis

The concordance index (c-index) is a metric used to evaluate the performance of predictive models, particularly in survival analysis. It is defined as the proportion of concordant pairs at all time points.

Python Native Lists vs. NumPy Arrays

TECHNOLOGY
Python Native Lists vs. NumPy Arrays

In Python, you can choose from various native data types to store collection data, including list, array, tuple, and dictionary. Among these, the list is highly flexible, can store any content, and is mutable, making it widely applicable. However, for scientific computing and storing purely numerical data, NumPy is widely used and has practically replaced lists. So, what are the differences between them, how significant are these differences, and how should they be applied in practice?

Hands-on Implementation of Random Forest Algorithm with Python

TECHNOLOGY
Hands-on Implementation of Random Forest Algorithm with Python

This article will guide you through a hands-on implementation of a powerful random forest machine learning model. It aims to complement my conceptual explanation of random forests, but as long as you have a basic understanding of decision trees and random forests, you can fully read it. Later, we will discuss how to improve the model built here.

python3 solution to LeeCode medium problem

TECHNOLOGY
python3 solution to LeeCode medium problem

This is an article analyzing a problem from the coding practice site LeeCode.

Calculating the Gini Coefficient and Plotting the Lorenz Curve with matplotlib

TECHNOLOGY
Calculating the Gini Coefficient and Plotting the Lorenz Curve with matplotlib

The Gini coefficient and Lorenz curve are widely used to represent data inequality, especially wealth inequality. However, currently in Python, there isn't a very good function to directly plot the Lorenz curve. Since the current project requires it, this article records how to use numpy, pandas, matplotlib, and other packages to calculate the Gini coefficient and plot the Lorenz curve for practical use.

Using folium to Draw a COVID-19 Pandemic Map

TECHNOLOGY
Using folium to Draw a COVID-19 Pandemic Map

After being contained in China, the COVID-19 pandemic became increasingly severe worldwide. Countries and regions publish daily new infection and death data to help fight the pandemic globally.

Application of Python Implementation of Gradient Descent in Practice

TECHNOLOGY
Application of Python Implementation of Gradient Descent in Practice

Gradient descent is a first-order optimization algorithm, commonly called the steepest descent method. To find a local minimum of a function using gradient descent, one must iteratively move from the current point in the opposite direction of the gradient (or approximate gradient) by a specified step size.